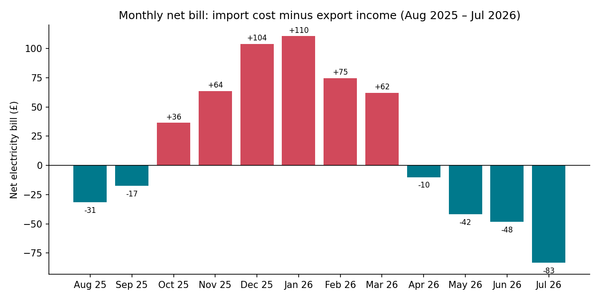
Unproven because unmeasured: what a year of data from my own heat pump says about the fuel poverty report
The Government's fuel poverty committee says the case that heat pumps cut bills for low-income homes "has yet to be proven". A year of data from one instrumented house says the heating passed. The committee is right that the evidence is missing. It already exists in the meters. Nobody is reading it.

Buried on page 53 of a 55-page report published this month is a sentence that ought to stop the heating industry in its tracks.
“That insulation saves money is widely understood by the public. The evidence that heat pumps will achieve similar savings has yet to be proven.”
It comes from the Committee on Fuel Poverty, the independent expert group that advises the Department for Energy Security and Net Zero, in its 2026 annual report, Warm. Affordable. Fair. This is not a lobby for the gas boiler. It is a small committee, chaired by a former energy minister, whose entire purpose is to make sure the people with the least money end up in warm homes. On the flagship technology of the Warm Homes Plan, it has looked for the evidence and found there isn’t much.
I have a heat pump. I also have a temperature sensor in almost every room, a pump that reports the heat it delivers and the electricity it uses every few seconds, a smart meter recording every half hour, and a year of it all sitting in a database. So my reaction to that sentence was not outrage. It was recognition. Of course it hasn’t been proven. To prove something you have to look at the measurements, and as a country we have installed the technology first and left the looking for later.
I am going to show you my numbers. As it turns out they are good news for the heat pump. They are also, I think, the most useful thing I can add to the debate, because the point is not what they say. It is that I can say it at all.
What the Committee actually said
It is worth being fair to the report, because it is more careful than a headline allows.
The Committee accepts that heat pumps will become the dominant heating system in British homes by the 2040s. It quotes the Climate Change Committee’s pathway, which needs installations in existing homes to climb from 60,000 a year in 2023 to nearly 450,000 a year by 2030 and around 1.5 million a year by 2035. For England that means something like 11.5 million existing homes having their gas central heating taken out and replaced. Nobody on the Committee is arguing with the destination.
What they argue with is the order of operations. Their phrase is “the cart before the horse”. A heat pump put into a cold, draughty house has to work much harder to hold the temperature, so the bills go up rather than down. Insulate the house afterwards and the heat pump you fitted is now oversized, so it short-cycles, switching on and off too often, wearing itself out and wasting electricity. Get the fabric right first, they say, then size the heating system for the house you actually have.
A heat pump put into a cold house has to work harder. Insulate afterwards and the heat pump is the wrong size. Either way, the bill is wrong.
Then there is the price of electricity. Under the current cap, gas costs 7.33p a unit and electricity 26.11p. A heat pump that is three to four times as efficient as a gas boiler, which is what the Climate Change Committee says a good one should be, is fighting a price ratio of three and a half to one. The margin between saving money and losing it is not wide. The Committee’s blunt summary is that unless electricity gets substantially cheaper, the long-term trajectory is to swap volatile gas prices for “stable but more expensive electricity prices”.
And finally, quality. The report reminds us what happened the last time we scaled a home upgrade programme faster than we could check it. The Public Accounts Committee found that of the external wall insulation installed under ECO4 and the Great British Insulation Scheme up to January 2025, an estimated 98 per cent of homes, somewhere between 22,000 and 23,000 of them, had defects needing remediation. Thirty-nine companies were suspended. The Committee on Fuel Poverty notes, almost in passing, that “even some recent heat pump upgrades” show the same pattern.
So its key recommendation on heat pumps is modest and, I think, exactly right: “more evidence to be collected as heat pumps are installed in low-income households to minimise the risks of either unsuccessful installations, or higher bills.”
Why the evidence is thin
The reason the evidence is thin is structural, and it goes well beyond heat pumps.
England’s fuel poverty statistics, the ones that tell us 2.36 million households were fuel poor in 2025 and project 2.13 million for 2026, rest on the English Housing Survey. The Government’s own health warning, quoted in the report, is that the survey covered 14,501 households with physical inspections across two years, and that “it is not possible to reliably estimate fuel poverty levels in smaller geographical areas, such as Local Authorities, without the use of statistical modelling.”
Fourteen and a half thousand houses standing in for twenty-five million. Everything below the national level is a model of a model.
The heat pump savings in the Warm Homes Plan are modelled too. The Plan says a household adopting a heat pump, solar panels and a battery “could save up to £550 per year”, with a range of £450 to £550 across four archetypes at 2024 prices. Those are not measurements from houses. They are outputs from the same family of standard assumptions that produce an Energy Performance Certificate, and an EPC, as anyone who has held one next to a real bill knows, describes a building, not the people living in it. Mine, for what it is worth, still says I have a gas boiler.
Then there is the number in the report that worries me most, and it has nothing to do with heat pumps. When Ofgem reset its typical consumption figures in July, it found that a typical household now uses around 7 per cent less electricity and 17 per cent less gas than it did in 2023. The Committee’s reading is stark: a drop that size, that fast, cannot be explained by insulation or boiler replacement. It “indicates that households are rationing their energy usage as a result of consistently high prices, leaving people in colder homes.”

Think about what that does to the evidence base. A fall in consumption is, in the aggregate statistics, indistinguishable from a success. A household that has gone cold to make the prepayment credit last looks, from Whitehall, exactly like a household that has had its loft done. Ofgem’s own data, quoted in the report, says around half a million gas customers and half a million electricity customers self-disconnected at least once last winter. Those households are the people the whole strategy is for.
If you cannot tell rationing from efficiency in the national numbers, you certainly cannot tell a well-installed heat pump from a badly installed one.
My house, in the weeds
So here is one house, measured. Space heating only: I have taken the hot water out of every figure that follows, because hot water is a different job with different physics, and it is the heating that the fuel poverty argument is about.
Before the heat pump went in, an MCS-accredited surveyor did what the rules require. He calculated the heat loss of the building room by room, arrived at a design figure of about 6.4 kilowatts on a design day of minus 1.5 degrees, and specified a 6 kilowatt Daikin unit running a flow temperature of 50 degrees. The survey put my annual space heating demand at 5,083 kilowatt-hours and the pump’s seasonal efficiency at a SCOP of 3.43, which means it expected to burn about 1,480 kilowatt-hours of electricity a year to heat the house. Three and a bit units of heat for every unit of electricity.
That is the number the Climate Change Committee has in mind when it says heat pumps are three to four times as efficient as a gas boiler, and it is the number the Warm Homes Plan’s savings are built on. It is also, in every home in the country, a prediction. Nobody comes back to check it.
I checked. The pump meters its own electricity, it reports the heat it puts into the water, and both have been logged every few seconds and published to an open monitoring platform since the week it was commissioned. For the twelve months from the start of September 2025 to the start of September 2026, with the hot water stripped out, the house reads as follows.
Space heat delivered: about 4,700 kilowatt-hours. Electricity used to deliver it: about 1,460 kilowatt-hours. Measured heating COP for the year: 3.2.
The survey said 3.43 and 1,480 units of electricity. The meter says 3.2 and 1,460. In my house the paperwork was right. I only know that because I looked.
Two things in that are worth pausing on. The first is that the house needed about 8 per cent less heat than the survey modelled. That is not a surveyor’s error; a design calculation is meant to be a safe worst case, and the surveyor’s 6.4 kilowatts on a design day works out at roughly 300 watts of heat loss for every degree of difference between inside and out, where a year of actual heat output plotted against actual indoor and outdoor temperatures puts normal operation nearer 170. Both are right. One is the day the system must never fail on, the other is the year you pay for. The second is that the efficiency held up through the hard part: the four weeks of January 2026 came in at a COP of about 3.2 as well, in the coldest month, with the pump running at almost the same efficiency as it managed in the mild shoulder weeks.
Now the sums, done the way the Committee would do them. At the current capped rates, 1,460 units of electricity at 26.11p is about £380 a year to heat my house. The gas boiler I took out, burning at a typical 90 per cent, would have needed around 5,200 units of gas to deliver the same heat, which at 7.33p is also about £380. On unit costs alone, the heat pump and the boiler are level to within a few pounds.
The saving is everything the unit rate does not show. First, the gas standing charge. A house with no gas boiler has no reason to keep a gas supply, and under the cap that charge is just under 30p a day, about £108 a year, paid whether you burn a single unit or not. The Committee has argued for years that standing charges are regressive, costing the smallest user the same as the largest; getting off gas altogether is the one way a household escapes one of them entirely. So in my house the honest comparison is roughly £380 against £490, a saving of about £110 a year on heating, before an intelligent tariff adds anything.
Second, carbon, which the Committee’s remit does not cover but the Warm Homes Plan’s does. Using the Government’s own 2026 conversion factors, the 5,200 units of gas my old boiler would have burned come to about 950 kilograms of carbon dioxide equivalent a year. The 1,460 units of electricity the pump used come to about 190 kilograms. That is a cut of roughly three quarters of a tonne, or about 80 per cent, from one house in one year, and the electricity figure falls every year the grid gets cleaner: the same factor was 26 per cent higher only twelve months ago. On bills, my heat pump is a modest win. On carbon, it is not close.
Go back to the unit-cost figures, because they are the Committee’s argument in one house. They say electricity costs three and a half times what gas does. My pump delivers 3.2 units of heat per unit of electricity. Three and a half against 3.2 is what breakeven looks like. A pump that runs at 2.5, and plenty do, loses about £110 a year to gas in this house on unit costs, which is to say it gives back the whole standing charge saving and the household is no better off. A pump running at 4, which the best installations manage with low flow temperatures and big radiators, saves about £75 on unit costs, or nearly £185 once the standing charge is counted. The entire outcome sits inside a range of efficiency that no certificate records, no survey can guarantee and no bill explains.
I can see all of this, which means I can act on it: nudge the flow temperature down, lengthen the schedule, and watch the number move the following week. A household on a prepayment meter, with no heat meter and nobody looking at the data, can do none of that. If their pump were running at 2.5 rather than 3.2 they would simply have a bill they did not expect and the sincere reassurance of everyone involved that heat pumps are three to four times as efficient as gas. Nobody would ever know which house was which.
You already know more than you think
Here is the part the “more evidence needed” framing misses. For a gas-heated home, three of the four numbers you need are already known, and the fourth can be worked out.
The physics of gas is not in dispute. A unit of gas through a modern condensing boiler gives about nine tenths of a unit of heat, and the boiler has no other job in winter than putting that heat into the house. So a home’s smart meter gas history, corrected for the weather that year, is not an estimate of its heat demand. It is a measurement of it. Every gas-heated home in Britain with a smart meter has been measuring its own heat demand for years, whether or not anyone has looked.
The archetype of the building tells you the shape that demand should take: how steeply gas use should climb as the outside temperature falls, and where the line should sit for a mid-terrace, a 1930s semi, a bungalow. Take enough homes of one type and their heat-loss lines cluster. A house that falls well off its cluster is telling you something, either about the fabric or about the people inside. This is exactly the method we are proving with the estate we monitor for the local Age UK: gas and degree days in, a heat-loss figure per home out, checked against the homes where we can see inside.
And my own survey, landing within 8 per cent of the measured year, says that a properly done MCS heat-loss calculation is not miles out either. The industry’s arithmetic is sound. What it lacks is the closing of the loop.
Every gas-heated home with a smart meter has been measuring its own heat demand for years. Nobody has looked.
Put those together and something useful falls out. Before a heat pump goes in, the heat the house needs is already on record. After it goes in, the electricity meter shows what the pump consumed to deliver it. Divide one by the other, weather-corrected, and you have a realised efficiency for every retrofitted home in the country, from data that already exists, with no hardware fitted and nobody sent round with a clipboard. Houses like mine, instrumented to the hilt, are the anchors that confirm the inference is honest. The study we have proposed is the proof that it holds across archetypes and across households you cannot see inside.
The Committee says the evidence needs to be collected. The better answer is that the smart meter rollout collected it. Nobody is reading it.
What a house can tell you
Where the meter alone runs out is the household. Add a temperature sensor in the room people actually sit in and a house starts to tell you things no certificate can.
It tells you whether the pump is doing its job. One delivering three units of heat or more per unit of electricity has a signature: steady, low, continuous demand through the cold hours. One that is short-cycling, or leaning on its electric backup because it was undersized, has a different signature, spiky and expensive. You do not need to send an engineer to see this. You need to look at the data on a Tuesday morning.
It tells you the difference between efficiency and rationing. A well-insulated home with a properly set-up heat pump holds a steady temperature at low cost. A home that is rationing shows the heating come on late, go off early, and the indoor temperature sag through the evening. Both use less energy than last year. Only one is a success story.
A house that has gone cold to make the credit last looks, from Whitehall, exactly like a house that has had its loft done.
And it tells you, over a few months, what kind of household this is: in all day or out at work, regular or starting to change, whether a cold snap produced the extra demand you would expect or oddly little. Ask five successive questions of a load profile and you arrive at something closer to a picture of a household’s wellbeing than any tick-box eligibility form.
In Dorset that picture goes to a trained energy adviser who can pick up the phone, not to a dashboard nobody opens. The Committee’s research says a successful heat pump transition for low-income households needs “practical handover and follow-up, in-situ performance monitoring, clear performance guarantees and effective routes to remediation where a system goes wrong”. Every one of those depends on somebody watching the numbers after the installer has driven away.
The tariff nobody should have to manage
There is a line in the Committee’s research findings that I want to underline, because it is the one place where the report reaches, almost reluctantly, for the technology I spend my days on.
Time-of-use tariffs, it says, “should not be assumed to benefit fuel poor households, unless the household is confident at managing them or automation removes that burden.”
Automation removes that burden. That is the case for artificial intelligence in domestic energy in four words, written by a government committee otherwise deeply suspicious of shiny technology.
A heat pump on a flexible tariff can warm a well-insulated house in the cheap hours and coast through the expensive ones. In my house, the difference between running the pump at the standard capped rate and running it intelligently against a cheaper overnight rate is where the next saving lives; on unit costs alone, as I showed above, my pump only breaks even, and the standing charge is a gain you bank once. But a pensioner on a prepayment meter should not be expected to become a day trader in electricity to get it. The system has to do it for them, quietly, and it has to be able to explain what it did, in plain language, when they ask.
I wrote in July about the factories that took fifty years to move from one steam engine driving every machine through belts and shafts to a small electric motor on each machine. The gain came not from the electricity but from redesigning the work around it. Bolting a smart tariff onto a household that has to manage it by hand is the line shaft again. The benefit only arrives when the intelligence sits inside the house and the person is freed from the shaft.
The ten thousand pound choice
The Warm Homes Plan sets £10,000 as a reasonable spend per property, and the new minimum standards for rented homes use the same cap. The Committee does some plain arithmetic with it. The Energy Saving Trust puts a typical heat pump installation at around £12,000. External wall insulation on a three-bedroom semi comes to about £10,000. Solar with a battery is somewhere between £10,000 and £14,000. The Committee’s conclusion is that under the cap “a choice will have to be made between solar/battery OR heat pump OR insulation”, and it is hard to see any two in combination.
The Government’s line that the average predicted cost is around half the cap gets a raised eyebrow: “it is difficult to see where the estimate of an average predicted cost of £5,000 per property comes from.”
Suppose the cap stays. Then for every one of the millions of homes in the programme, someone has to choose the single measure that will do the most good. You cannot make that choice well from an EPC. Two identical three-bedroom semis on the same street, one occupied all day by someone in their eighties, the other empty from eight till six, do not want the same £10,000 spent on them. One needs the fabric. The other might get more from a heat pump on an automated tariff. The only way to know is to look at how each house actually behaves, and to check that behaviour against houses of the same type where you already know the answer.

That last step is the one I care about most, and it is where my own house earns its keep. A single well-instrumented home is an anchor. Its measured heat loss, its measured heat pump performance and its measured schedule become the reference against which a model built from smart meter data alone, for a house of the same archetype with no sensors at all, can be checked and corrected. Get enough anchors across enough archetypes and the smart meter model stops being a guess. It becomes a calibrated instrument that can screen thousands of homes without putting hardware in any of them, and say, with an honest confidence figure attached, which of the three measures this particular house needs first.
We have put a proposal to Innovate UK to do exactly that with a few hundred low-income homes in Dorset: temporary temperature sensors and adviser visits as the independent reference, the smart meter model as the thing under test, and the results published warts and all, including the cases where the method gets it wrong. The Committee also points out the trap on the other side of the cap. Fit the heat pump first under one funding pot and insulate later under another, and you have a heat pump that is now the wrong size. Programmes that treat each measure as a separate transaction will keep doing this. A programme that holds a living picture of the house, updated by the house itself, would not.
Evidence-led, at the speed required
The scale of what is being attempted gets lost in the policy language. The Committee works it through. To meet the old statutory target, every fuel poor home at EPC C by the end of 2030, the upgrade programme would need to complete around 35,000 homes a month, every month, from now until then. The Committee regrets, in so many words, that this will not happen. The new Warm Homes Agency, due from 2027, inherits a target of five million homes upgraded and a million households lifted out of fuel poverty by 2030, along with the wreckage of ECO4.
At that pace, quality assurance cannot mean sending an inspector to a sample of homes a year later. That is how we found out about the 98 per cent. It has to be built in: every installation reporting its own performance from the first cold week, exceptions flagged automatically, a human adviser following up on the ones that matter. A pump running at 2.5 instead of 3.2 would be flagged in the first cold fortnight, not discovered on the spring bill.
The report’s other recommendation on data is the one I would most like ministers to act on. It asks that “data restrictions are amended to enable the pooling of data and effective partnership working” between councils, mayors, the NHS, housing providers and charities, so that programmes can be targeted at neighbourhood level rather than from a survey of 14,501 homes. The Committee has been calling this a “revolution” in data sharing for several reports now. Data protection is not a reason to do nothing. Done properly, with consent, with the household in control and the analysis happening as close to the home as possible rather than in somebody else’s cloud, it is the difference between reaching a family before the crisis and describing them afterwards.
Prove it
I should say clearly where I stand, because this could be read as a technologist talking his own book. I think heat pumps are the right long-term answer for most British homes, including mine; I am not taking it out. I think the Committee is right that fabric comes first, and right to be sceptical of savings figures that have not been measured in real houses with real people in them. Those positions are not in tension. They point at the same missing piece.
The heating industry has spent a decade asking the public to trust it. The Committee on Fuel Poverty has just replied, politely, that trust is not evidence. The good news is that the evidence is already there: the smart meter rollout has been collecting it for years, the physics that turns it into an answer is settled, and the technology to read it is ordinary. What is missing is the decision to look.
So here is the proposition. Every heat pump fitted with public money in a low-income home should come with monitoring as standard, the data should go to a person who can act on it, and after a winter or two we should publish what we found, house by house, warts and all. If the savings are real, that is how the industry earns the confidence it keeps asking for. If they are not, the households who can least afford to find out the hard way will have been spared. I have started with my own house. It came in at 3.2 against a promise of 3.43, and I would be saying so just as loudly if it had come in at 2.5. That is rather the point.
Unproven, the Committee says. Fair enough. Let’s measure it.
Craig Lewis is a technologist working in domestic energy and a co-founder of LDS Consultancy. He holds a City & Guilds Level 3 in energy advice and works with Age UK North, South & West Dorset on smart meter monitoring for older households.
Sources and notes
- Committee on Fuel Poverty, Warm. Affordable. Fair. The journey to eliminate fuel poverty, Annual Report 2026, September 2026, Crown copyright, Open Government Licence v3.0. Published on the Committee’s GOV.UK pages: Committee on Fuel Poverty. All quotations and national figures are from the report: the “has yet to be proven” line and “cart before the horse” (Chapter 4 and Final Conclusions); the CCC installation trajectory and 11.5 million retrofits (Chapter 4); £450 to £550 archetype savings at 2024 prices (Warm Homes Plan, quoted in Chapter 4); £12,000 typical heat pump cost (Energy Saving Trust, quoted); £10,000 cap and the “£5,000 average” query (Chapter 4); 14,501 households and the health warning on sub-regional data (Chapter 2); 7 per cent and 17 per cent consumption falls and the rationing interpretation (Chapter 3); half a million self-disconnections (Ofgem, quoted in Chapter 3); 98 per cent external wall insulation defects and 39 suspensions (Public Accounts Committee, quoted in Chapter 1); 35,000 homes a month (Chapter 5); the heat pump research findings and the key recommendation on evidence (Chapter 4); the data pooling recommendation (Chapter 2).
- Committee on Fuel Poverty research, How to ensure a successful transition to heat pumps for households at risk of fuel poverty, 2025-26, GOV.UK.
- Ofgem: energy price cap unit rates and standing charges, July to September 2026: gas 7.33p/kWh, electricity 26.11p/kWh.
- Climate Change Committee, Seventh Carbon Budget: “around half of homes in the UK heated using a heat pump” by 2040; heat pumps “around three-to-four times more efficient than gas boilers”, both as quoted in the CFP report.
- The author’s house: MCS heat loss survey and design figures from the installer’s pre-installation survey (Daikin 6 kW, design flow 50 °C, design outdoor temperature minus 1.5 °C, annual space heating demand 5,083 kWh, hot water 2,080 kWh, SCOP 3.43). The survey’s electricity figure of 2,362 kWh covers both; the space heating share is taken pro rata at the survey SCOP, 5,083 / 3.43 ≈ 1,482 kWh. Measured figures from the emoncms MyHeatpump feeds, cumulative kWh accumulators differenced between 4 September 2025 and 3 September 2026: total heat output 6,247 kWh (feed “ESPAltherma Output Power to kWh”), total heat pump electricity 1,844 kWh (feed “Heatpump Active Energy”). Hot water is removed using the summer baseline, 19 June to 31 July 2026, when the pump was doing nothing else: 4.29 kWh heat and 1.05 kWh electricity per day, scaled to 1,566 kWh heat and 384 kWh electricity a year. Space heating is therefore 6,247 − 1,566 ≈ 4,681 kWh heat for 1,844 − 384 ≈ 1,460 kWh electricity, COP 3.21. January 2026 (1 to 29 Jan): 1,282 kWh total heat and 388 kWh electricity, less 28 days of the hot water baseline, ≈ 1,162 kWh heat for 359 kWh electricity, COP 3.24. Heat output is the unit’s own reported output rather than a separate MID heat meter, the usual caveat for this class of monitoring. Design heat loss about 300 W/K; measured operating heat loss about 170 W/K from the LDS platform’s fit of daily heat against indoor minus outdoor temperature.
- Gas standing charge: Ofgem price cap, 29.68p per day for a direct debit customer from 1 October 2026, ≈ £108 a year. Carbon: 2026 UK Government greenhouse gas conversion factors, natural gas 0.18231 kgCO2e/kWh (gross CV) and UK grid electricity 0.131 kgCO2e/kWh location-based (2025 factor 0.177, a 26 per cent fall). Gas: 5,201 kWh × 0.18231 ≈ 948 kg. Heat pump: 1,460 kWh × 0.131 ≈ 191 kg. Saving ≈ 757 kg, about 80 per cent. Sources: Ofgem price cap rates, Greenhouse gas reporting: conversion factors 2026, GOV.UK.
- Cost arithmetic uses the July to September 2026 capped unit rates above. Heat pump as measured: 1,460 kWh × 26.11p ≈ £381. Gas equivalent: 4,681 kWh of heat at 90 per cent boiler efficiency ≈ 5,201 kWh of gas × 7.33p ≈ £381, excluding the gas standing charge. At COP 2.5: 1,872 kWh × 26.11p ≈ £489, about £108 more than gas. At COP 4: 1,170 kWh × 26.11p ≈ £306, about £75 less than gas. A heat pump tariff or overnight rate changes these sums; the piece says so. From 1 October 2026 the cap moves to gas 7.97p and electricity 26.32p, which nudges the unit-cost comparison slightly further in the heat pump’s favour; the body keeps the July to September figures because they are the ones the Committee quotes.
- The July 2026 article referred to is The Forty Year Light Switch on this site.